For developper
- Run
>>> git clone git@github.com:langevinmodel/folie.git
>>> cd folie
>>> pip install -e .
to install the package for local developpement.
Input of trajectories data
Building an estimator of Langevin dynamics
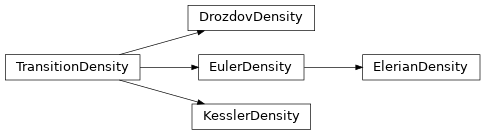
Likelihood estimation: using Transition density
The list of implemented transition density and their relations
Writing a new estimator
Estimator should generically inherit from :class`Estimator` and implement a fit method. Since most estimator of folie are flexible they generally take as argument the model to be estimated, but if your estimator is model specific you are not force to follow this approach.
Model of Langevin Dynamics
Folie holds a number of models for Langevin Dynamics. The main models simply contain reference to functions that describe the spatial dependences as well as the associated coefficients.
There is also some
Writing a new model
A model in folie represent a model of Langevin evolution. As such, it is mainly a collections of folie functions.
Most of the time, the spatial dependencies of the model are described by folie functions and can simply be set as model attributes.
When more complicated behavior are necessary (for exemple the mean displacement of a Langevin model is the sum of its force and its friction times the velocity), the is a mecanism of ModelOverlay.
ModelOverlay is a particular type of functions. This is an interface for model methods adn as such it allow for easy composition of functions.
model.mycomponent = ModelOverlay("_mycomponent")
allow to access to the method of the models as if there was function attributes. This means that we can use
model.mycomponent.grad_coeffs()
as a call to
model._mycomponent_coeffs()
This allows to have an unified interface to components of a model, irrespective of theirs definitions as model methods or as folie functions.
Writing a new function
Functions are the core part of folie for the description of spatial dependences. Functions can be parametric functions (i.e. with coefficients to be optimized) or non-parametric.
Documenting the code
When documenting your code, numpydoc style should be used. Going back to the example
of the MeanEstimator, this style of documentation would look like the following:
class SimpleEstimator(folie.base.Estimator):
    r""" A simple estimator. It estimates the mean using a complicated algorithm
    :footcite:`author1991`.

    Parameters
    ----------
    axis : int, optional, default=-1
        The axis over which to compute the mean. Defaults to -1, which refers to the last axis.

    References
    ----------
    .. footbibliography::

    See Also
    --------
    Overdamped
    """

    def __init__(self, axis=-1):
        super().__init__()
        self.axis = axis

    def fit(self, data):
        r""" Performs the estimation.

        Parameters
        ----------
        data : ndarray
            Array over which the mean should be estimated.

        Returns
        -------
        self : MeanEstimator
            Reference to self.
        """
        self._model = MeanModel(np.mean(data, axis=self.axis))
        return self
Note the specific style of using citations. For citations there is a package-global BibTeX file under
docs/references.bib. These references can then be included into the documentation website
using the citation key as defined in the references file.
The documentation website is hosted via GitHub pages. Please see the README on GitHub for instructions on how to build it.
Organisation of the examples folder
folie use sphinx gallery to automatically generate plot of the examples. To be inclued into the Generals examples list, the script shoub be nammed as plot_*.py and be placed in to the examples foler.
The tutorials folder contain more complex examples on the form of Jupyter notebooks, anything in the tutorials folder will be inclued into the corresponding documentation section. The name of the snippset will be the title of the jupyter notebook.
The statistical_performances folder aims to contains Jupyter notebook that explore more systematically the peformance of the estimation with respect to number of data, choice of the estimator and so forth.