Note
Go to the end to download the full example code.
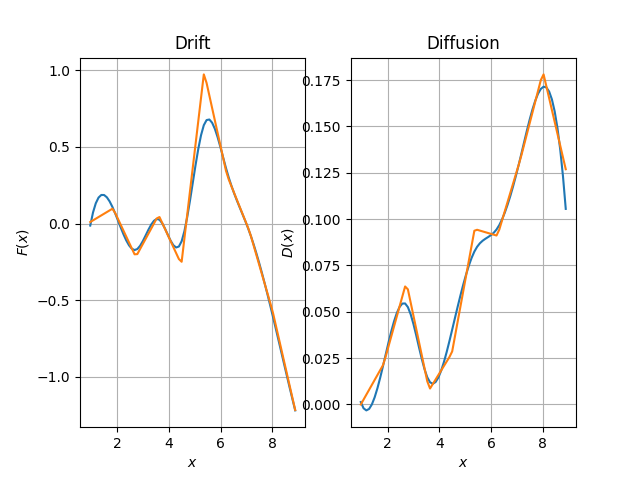
Overdamped Langevin Estimation
How to run a simple estimation with FEM functions

import numpy as np
import matplotlib.pyplot as plt

import folie as fl
import skfem

# Trouver comment on rentre les données
trj = np.loadtxt("datasets/example_2d.trj")
data = fl.Trajectories(dt=trj[1, 0] - trj[0, 0])
for i in range(1, trj.shape[1]):
    data.append(trj[:, i : i + 1])

fig, axs = plt.subplots(1, 2)
# Force plot
axs[0].set_title("Drift")
axs[0].set_xlabel("$x$")
axs[0].set_ylabel("$F(x)$")
axs[0].grid()

# Diffusion plot
axs[1].set_title("Diffusion")
axs[1].grid()
axs[1].set_xlabel("$x$")
axs[1].set_ylabel("$D(x)$")

xfa = np.linspace(data.stats.min, data.stats.max, 75)


n_knots = 10
epsilon = 1e-10
domain = fl.MeshedDomain.create_from_range(np.linspace(data.stats.min - epsilon, data.stats.max + epsilon, n_knots))

fem = fl.functions.FiniteElement(domain, element=skfem.ElementLineP1())
bsplines = fl.functions.BSplinesFunction(domain=domain)
for fun in [bsplines, fem]:
    model = fl.models.Overdamped(fun, dim=1)
    estimator = fl.KramersMoyalEstimator(model)

    model = estimator.fit_fetch(data)

    axs[0].plot(xfa, model.drift(xfa.reshape(-1, 1)))
    axs[1].plot(xfa, model.diffusion(xfa.reshape(-1, 1)))

plt.show()
Total running time of the script: (0 minutes 0.926 seconds)