Note
Go to the end to download the full example code.
ABMD biased dynamics
Estimation of an overdamped Langevin in presence of biased dynamics.
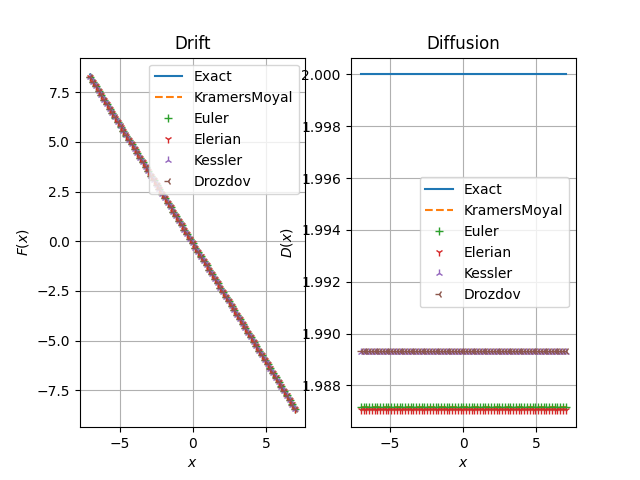
KramersMoyal [-0.09523337 -1.20344972  1.98717458] True
Euler [-0.09273452 -1.19243504  1.98714926] True
Elerian [-0.09266329 -1.19241238  1.98703479] True
Kessler [-0.09285272 -1.19370603  1.98930625] True
Drozdov [-0.09277839 -1.19378205  1.98932429] True
import numpy as np
import folie as fl
import matplotlib.pyplot as plt


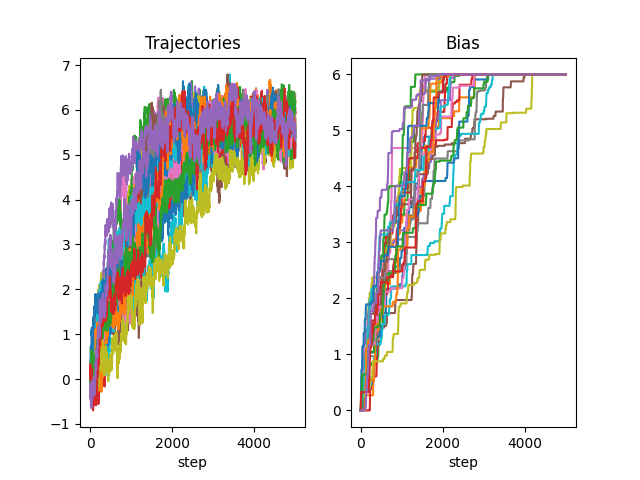
# First let's generate some biased trajectories

model_simu = fl.models.OrnsteinUhlenbeck(0.0, 1.2, 2.0)
simulator = fl.simulations.ABMD_Simulator(fl.simulations.EulerStepper(model_simu), 1e-3, k=10.0, xstop=6.0)
data = simulator.run(5000, np.zeros((25,)), 1)
xmax = np.concatenate(simulator.xmax_hist, axis=1).T

# Plot the resulting trajectories
# sphinx_gallery_thumbnail_number = 1
fig, axs = plt.subplots(1, 2)
for n, trj in enumerate(data):
    axs[0].plot(trj["x"])
    axs[1].plot(xmax[:, n])

axs[0].set_title("Trajectories")
axs[0].set_xlabel("step")
axs[1].set_title("Bias")
axs[1].set_xlabel("step")

fig, axs = plt.subplots(1, 2)
axs[0].set_title("Drift")
axs[0].set_xlabel("$x$")
axs[0].set_ylabel("$F(x)$")
axs[0].grid()

axs[1].set_title("Diffusion")
axs[1].set_xlabel("$x$")
axs[1].set_ylabel("$D(x)$")
axs[1].grid()


xfa = np.linspace(-7.0, 7.0, 75)
model_simu.remove_bias()
axs[0].plot(xfa, model_simu.drift(xfa.reshape(-1, 1)), label="Exact")
axs[1].plot(xfa, model_simu.diffusion(xfa.reshape(-1, 1)), label="Exact")

name = "KramersMoyal"
estimator = fl.KramersMoyalEstimator(fl.models.OrnsteinUhlenbeck(has_bias=True))
res = estimator.fit_fetch(data)
print(name, res.coefficients, res.is_biased)
res.remove_bias()
axs[0].plot(xfa, res.drift(xfa.reshape(-1, 1)), "--", label=name)
axs[1].plot(xfa, res.diffusion(xfa.reshape(-1, 1)), "--", label=name)

for name, marker, transitioncls in zip(
    ["Euler", "Elerian", "Kessler", "Drozdov"],
    ["+", "1", "2", "3"],
    [
        fl.EulerDensity,
        fl.ElerianDensity,
        fl.KesslerDensity,
        fl.DrozdovDensity,
    ],
):
    estimator = fl.LikelihoodEstimator(transitioncls(fl.models.OrnsteinUhlenbeck(has_bias=True)))
    res = estimator.fit_fetch(data)
    print(name, res.coefficients, res.is_biased)
    res.remove_bias()
    axs[0].plot(xfa, res.drift(xfa.reshape(-1, 1)), marker, label=name)
    axs[1].plot(xfa, res.diffusion(xfa.reshape(-1, 1)), marker, label=name)
axs[0].legend()
axs[1].legend()
plt.show()
Total running time of the script: (0 minutes 2.644 seconds)

